Quick Start
Once a user has installed earthkit-data and has their credentials in place, you can make a simple request.
An example of a time-series requested via earthkit-data:
import earthkit.data

request = {
    "class": "od",
    "stream" : "enfo",
    "type" : "pf",
    "date" : -1,  # Note: date must be within the last two days
    "time" : "0000",
    "levtype" : "sfc",
    "expver" : "0001",
    "domain" : "g",
    "param" : "164/167/169",
    "number" : "1/to/50",
    "feature" : {
        "type" : "timeseries",
        "points": [[-9.10, 38.78]],
        "axes": "step",
        "range" : {
            "start" : 0,
            "end" : 360,
        }
    },
    "format": "covjson",
}

ds = earthkit.data.from_source("polytope", "ecmwf-mars", request, stream=False, address='polytope.ecmwf.int')
The following will return a timeseries starting yesterday at midnight with steps from 0 to 360 including all steps available in between, for the parameters 164/167/169 at the point given. This data will be returned for each ensemble number requested.
"polytope" refers to the underlying service being used to return the data. "ecmwf-mars" is the dataset we are looking to retrieve from. Setting stream=False returns all the requested data to us once it is available. address points to the endpoint for the polytope server.
To view the returned covjson run:
ds._json()
To convert your covjson into an xarray the following can be done:
ds.to_xarray()
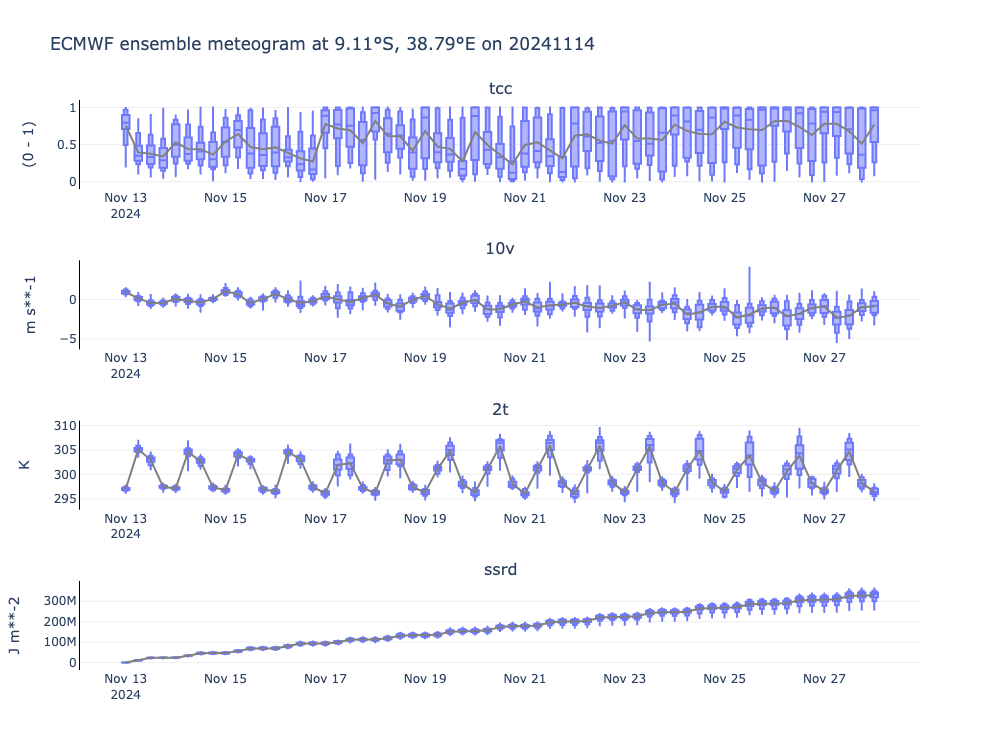
The following visualisation can be created using the latest version of earthkit-plots.
from earthkit.plots.interactive import Chart

TIME_FREQUENCY = "6h"
QUANTILES = [0, 0.1, 0.25, 0.5, 0.75, 0.9, 1]

chart = Chart()
chart.title(f"ECMWF ensemble meteogram")
chart.box(ds, time_frequency=TIME_FREQUENCY, quantiles=QUANTILES)
chart.line(ds,aggregation='mean', line_color='grey', time_frequency=TIME_FREQUENCY)
chart.show(renderer="png")  # Replace with chart.show() in an interactive session!
For more information about each feature see the Features page.